
To better understand the methods, procedures, and resources that teams need to accomplish high software delivery velocity and performance, DevOps Research and Assessment (DORA) was established as the field of DevOps gained wider recognition. To gauge their effectiveness in four crucial areas, engineering teams can utilize the four essential measures that the startup established as the “DORA Metrics.”
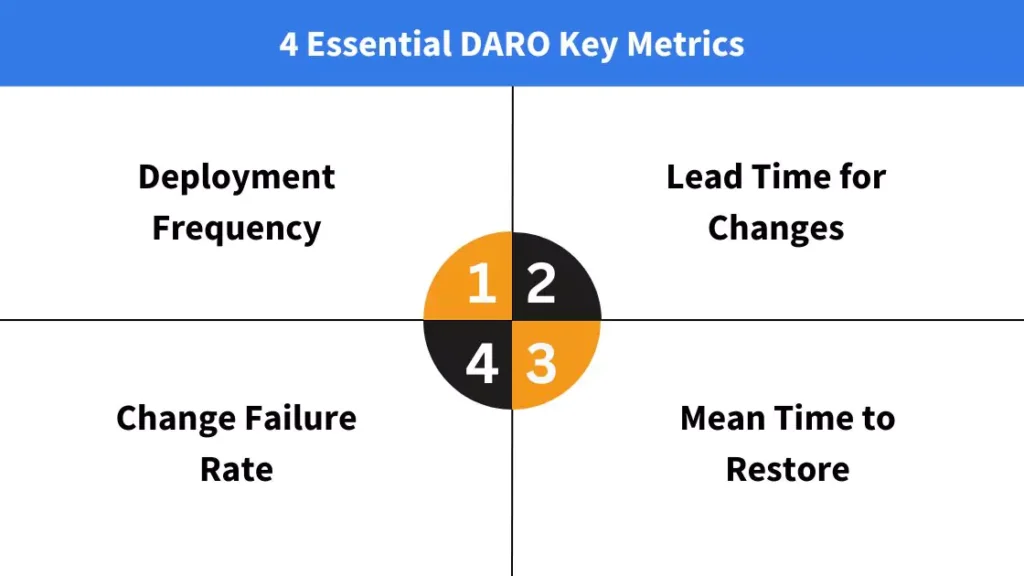
DORA has four primary metrics, split into two primary DevOps domains: Team velocity is measured by Deployment frequency and Lead time for changes. To measure stability by Changing failure rate and Mean Time to recover.
When DORA first started, it was a Google Cloud team dedicated to evaluating DevOps performance using a common set of metrics. Their objective is to accelerate velocity while enhancing performance and teamwork. By assisting in the setting of objectives based on present performance and the subsequent tracking of progress toward those objectives, these metrics help DevOps teams worldwide implement continuous improvement. Comparing their teams to other parts of the industry, identifying areas for improvement, and implementing necessary changes, gives engineering leaders more authority. This gives engineering executives the ability to measure their teams against the industry standard, spot areas for improvement, and implement solutions.
What are DORA Metrics?
Gene Kim and Jez Humble founded DevOps Research and Assessment (DORA), a startup led by Dr. Nicole Forsgren. Known for their highest-selling publications like The DevOps Handbook, Gene Kim and Jez Humble are well-known. In 2018, Dr. Nicole Forsgren also collaborated with the two to co-author Accelerate.
The business offered evaluations and analyses of an organization’s DevOps proficiency. They wanted to know what factors contribute to a team’s ability to produce software rapidly and at a high level of quality. The startup, which Google purchased in 2018, is still the biggest research initiative of its sort. They conduct annual surveys with thousands of experts to collect information on the main factors influencing engineering performance and delivery. Key benchmarks, market trends, and insights that might help teams do better are all included in their annual reports.
DORA Metrics: What are They?
DORA metrics are a collection of four measures that are used by DevOps teams to assess their performance. DORA determined which metrics were most closely connected with success. The mean lead time for changes, change failure rate, mean time to recover, and deployment frequency are the four measures. They were found through a six-year analysis of survey responses from more than 31,000 professionals worldwide.
Deployment Frequency:
The frequency of code deployments to a production environment that is successful is measured by a metric called deployment frequency (DF). This metric represents the mean production rate of a group over a certain duration, and it can be employed to gauge the frequency with which an engineering team delivers value to clients.
To enhance client retention and maintain an advantage over competitors, engineering teams typically aim to release new features to users as soon as possible. Instead of combining everything into a single, bigger release that is distributed within a set window, more productive DevOps teams consistently deliver smaller deployments. Teams at the top of their game, or peak performers, deploy many times a day, whereas high performers deploy once a week at the latest.
Teams that perform poorly on this metric may need to work on improving their automated evaluation and verification of new code. Reducing the size of pull requests (PRs), dividing up changes into manageable pieces, and increasing deploy volume overall could all be further areas of effort. A measure of how frequently changes are sent to production is called DF. On-demand or frequent code deployments to production are typical of high-performing teams. The DF will be lower if deployment is done weekly or monthly.
As per Google Cloud’s State of DevOps 2021 report, the frequency of deployment for different performers is as follows:
Deployment Frequency for different performers: How frequently do you deploy code into production?
- Elite: Daily multiple deployments
- High: One weekly or one monthly deployment
- Moderate: One deployment every two to three months
- Low: Less than one six-month period of deployment
What are the Ways Might Deployment Frequency be Increased?
If your company is classified as a low-performer, you need to use an automated deployment pipeline that does feedback mechanisms and new code testing automatically. As a result, recovery and delivery times are shortened. An organization can quickly address problems and move left in terms of development, security, and quality when deployments are automated. Significantly shorter approval and soak times as well as faster time to market are other benefits of automation.
Lead Time for Changes:
Engineering leaders can better analyze their development process’ efficiency once coding has started by using Mean Lead Time for Changes (MLTC). By calculating the average time between a branch’s first commit and when it is operationally operating in production, this statistic calculates the length of time it takes for a change to reach a production environment. In less than a day, the top teams can go from commitment to production, which measures how quickly the work will be delivered to clients. An MLTC of approximately one week is typical for teams.
Engineering leaders must have a precise grasp of how long it typically takes their team to get changes into production, as deployments might be postponed for several reasons, such as batching up related features and prolonged events.
Leaders aiming to enhance this statistic can study measures like Time to Open, Time to First Review, and Time to Merge, which correspond to the steps of their development pipeline, to pinpoint process bottlenecks. Teams aiming to enhance this statistic should think about making investments in automated testing and deployment procedures, increasing the effectiveness of their code review process, or segmenting work into smaller pieces to decrease the number of PRs.
Lead time for changes? How much time does it take for the committed code to function properly in an actual production setting?
- Elite: Fewer than one every 60 minutes.
- High: Approximately one day to one week
- Medium: In between one and six months is considered.
- Low: Extended past six months
What are some ways to improve lead time to changes?
DevOps teams need to incorporate automated testing into the development process to improve the lead time to changes. Your Dev teams can learn how to write and automate tests from your testing team. Regression unit tests can also be added to decrease the change lead time and detect regressions caused by code changes as soon as possible.
Change Failure Rate:
The percentage of deployments that result in a production failure is known as the Change Failure Rate (CFR), and it is determined by dividing the total number of deployments by the number of incidents. Leaders can use this information to gauge the caliber of code being released and, consequently, how much time the team is spending troubleshooting bugs. The majority of DevOps teams can attain a change failure rate of 15% to 0%.
Bugs are almost expected when modifications are routinely deployed to production environments. These errors can occasionally be trivial, but they can also occasionally cause significant problems. Though it’s crucial to remember that these shouldn’t be used as an excuse to pick out an individual or group for blame, engineering leaders must also keep an eye on how frequently these instances occur.
An essential counterbalance to the DF and MLTC measures is this one. Even while your team is working quickly, you also want to make sure they are producing high-quality code since successful, high-performing DevOps teams depend on both stability and throughput.
Change Failure Rate: What percentage of releases or deploys have encountered a service failure?
- Elite: 0–15%
- Elevated: 16–30%
- Moderate: 16–30%
- Low: 16–30%
What are the ways to improve the change failure rate?
Rather than concentrating on the number of failures, DevOps teams should prioritize the change failure rate. This disproves the mythical convention that states that failure rates decrease with the quantity of releases. Therefore, to swiftly and easily fix issues, teams must push releases more frequently and in smaller batches. Ensuring that all CI/CD procedures—such as fixing serious flaws and vulnerabilities in the code, putting appropriate regression approaches in place, and doing automated performance testing—have been adhered to strictly is also excellent.
Mean Time to Restore:
The amount of time it takes to get a system back to its regular functioning is called Mean Time to Restore, or MTTR. It appears that exceptional teams can heal in less than an hour, while many teams are more likely to recover in less than a day. While errors do occur, DevOps teams must be able to swiftly bounce back from them in a live environment. DevOps teams must become more observable to detect and fix errors more rapidly to increase MTTR.
Mean Time to Restore: In the event of a service interruption, how long does it take to restore service?
- Elite: In under 60 minutes
- High: A day or less
- Medium: a duration of one day to one week
- Low: Extended beyond six months
How Can You Improve the Meantime to Restore?
Businesses need to use fast recovery procedures and strong monitoring systems to reduce the time to restoration. Teams can use this to implement a backup plan in case something goes wrong and they need to react quickly. To discover potential failures and take proactive measures to detect and address problems before they arise, businesses should also begin investing in auto-healing systems and prediction approaches.
Also Read: Easy Guide to Install Visual Studio Code on Ubuntu
How to Optimize DORA Metrics?
When trying to gauge how an engineering team is doing right now or how it has changed over time, the DORA metrics are an excellent place to start. However, it is not fully told by DORA measurements. They should be viewed in conjunction with non-DORA indicators such as PR Size or Cycle Time to obtain a deeper understanding. Teams can find areas for improvement and formulate questions by examining correlations between specific metrics.
Furthermore, the research team regularly discusses additional aspects that affect engineering success, even though the DORA measurements are arguably the most well-known component of the yearly DORA report. Code review and team spirit are two further factors that are taken into account for high-performing teams; these are covered in detail in the 2023 report. The 2023 Accelerate State of DevOps study from Google Cloud’s DevOps Research and Assessment (DORA) team emphasizes the influence of process improvements, user-facing tactics, and culture on engineering performance.
Four essential DORA metrics—benchmarks for measuring the speed and stability of an engineering organization—are emphasized in the paper. These measurements serve as both a starting point for development and an entry point for a more data-driven style of leadership. The 2023 report takes a broader approach to measuring and identifies more ways to improve engineering performance. Code review, which sheds light on a team’s capacity for cooperation and communication, and team culture, which is not initially amenable to assessment, are two important aspects that are highlighted.
Leaders can improve their knowledge of their team by examining these aspects in conjunction with DORA measurements. It’s also critical to remember that the four DORA indicators are typically calculated differently, even within teams within the same organization, due to the lack of standard computations. To make precise judgments on velocity and steadiness among teams, executives must guarantee that the definitions and computations for every metric are uniform across their establishment.